Which place? Which dates?
Source, acquisition dates, resolution and usable coverage.
Satellite and GIS analysis
Compare sites, measure change and investigate your own questions with an AI assistant for GIS. Describe the outcome, review the data and method, and explore results as maps, measurements, charts or reports without writing the GIS code yourself.
Try the prepared examples below. They illustrate the workflow without running a live analysis.
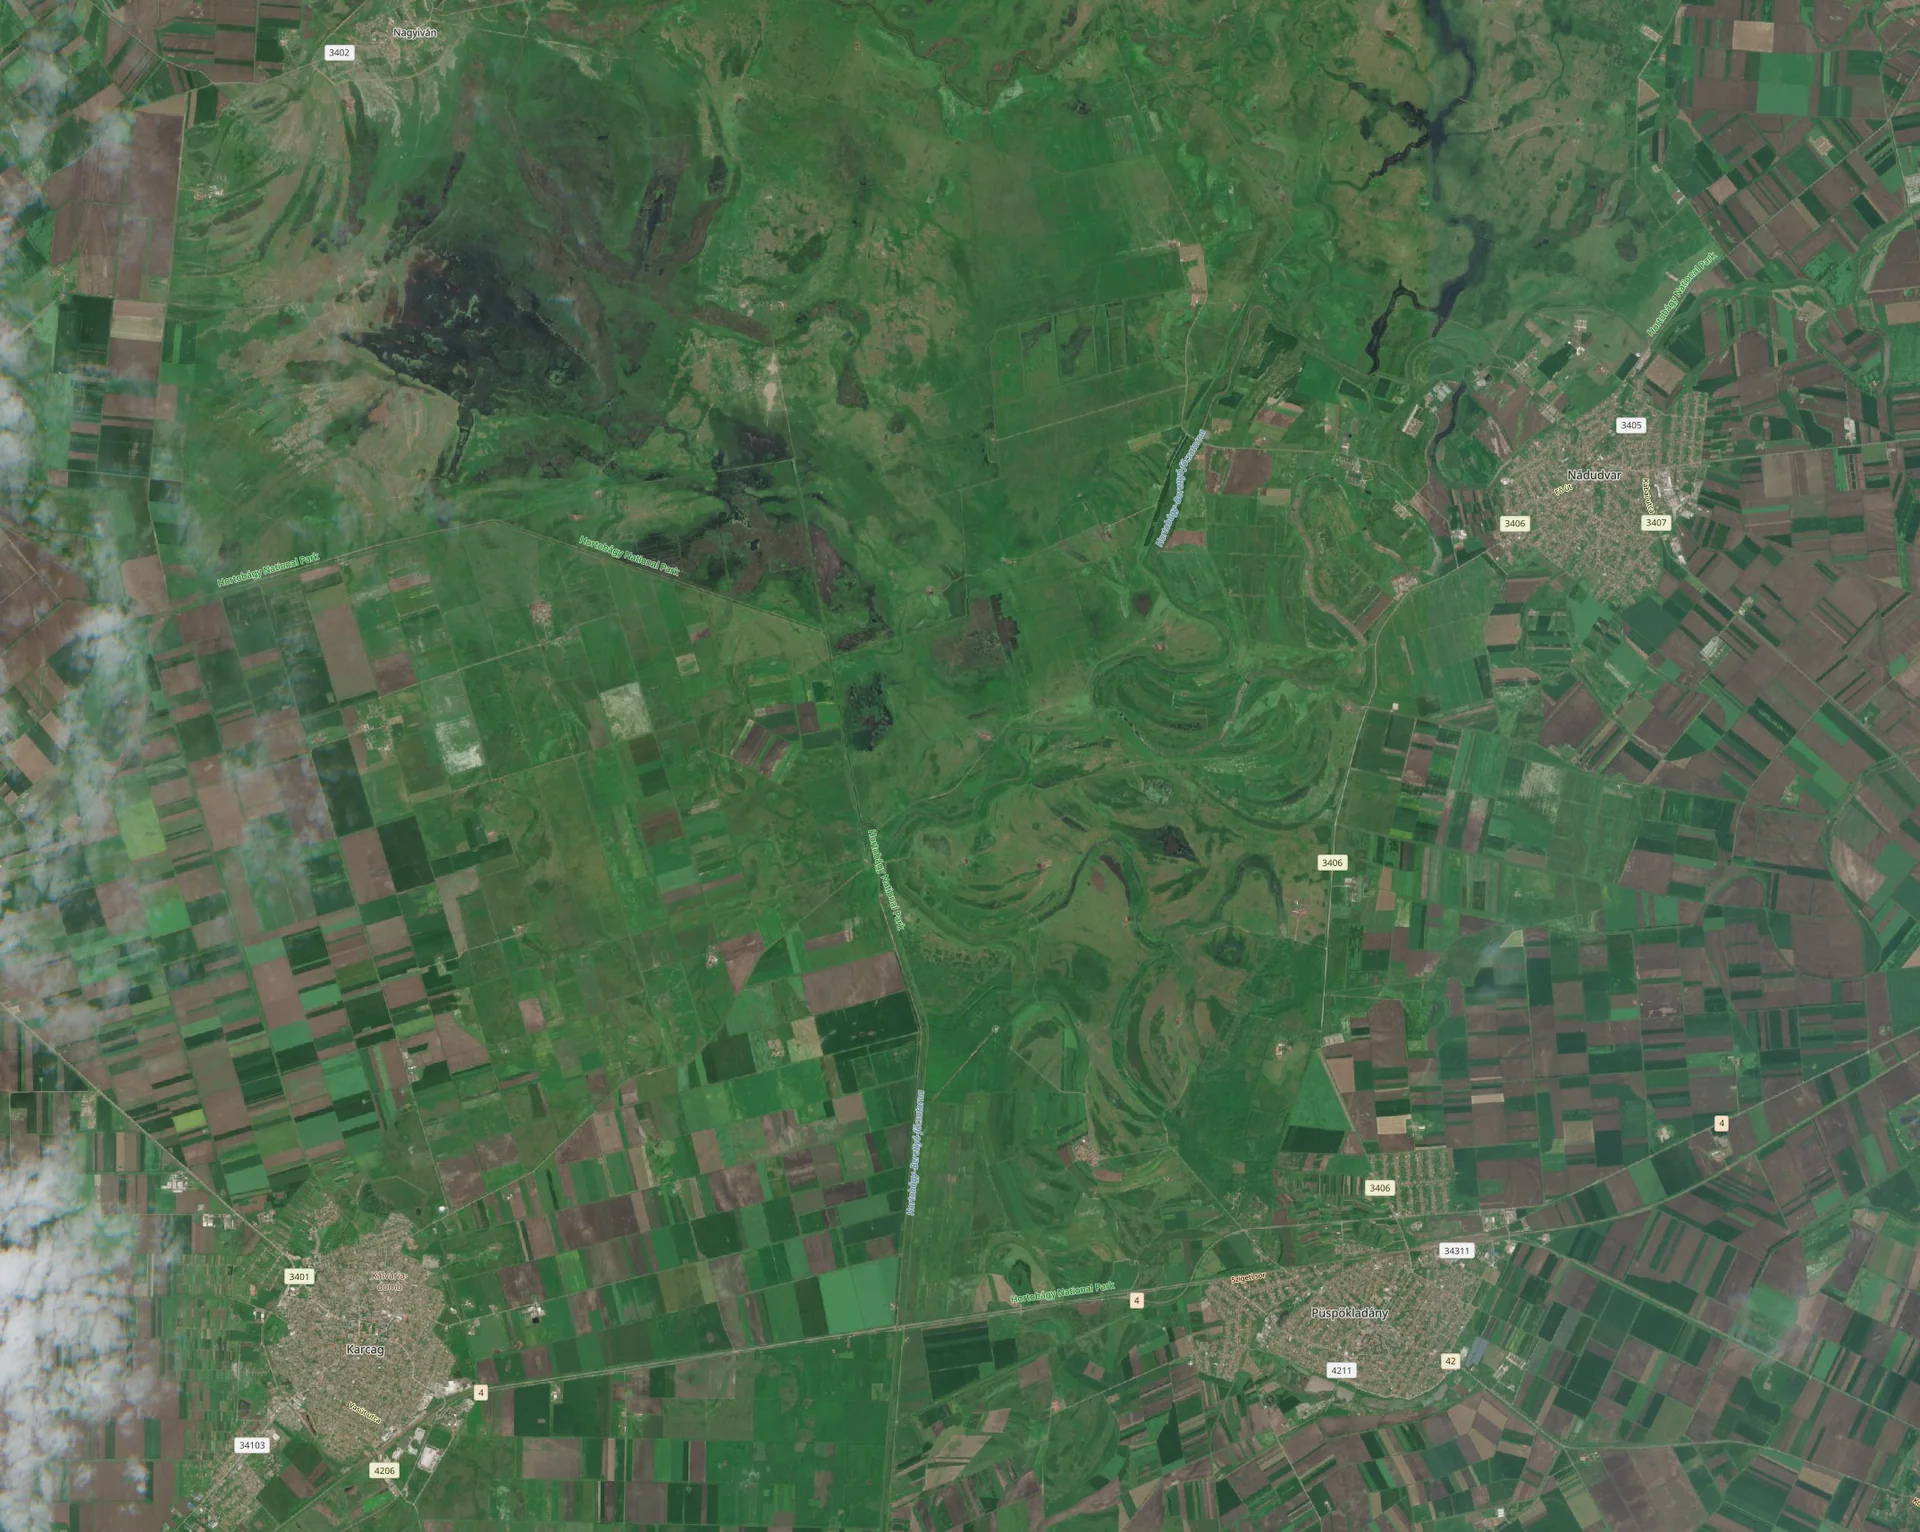 Investigate this areaIllustrative review overlay
A visible pattern is a starting point.
Check dates, quality and field context.
Choose a sample question
Choose a task to see the kind of result an analysis could provide.
The sample shows a lower greenness reading at North field. That could guide an inspection; it cannot explain the cause.
Map values: 26 Jun 2025 · synthetic example
Synthetic comparison. Exact values are also available in the table.
| Area | 12 May 2025 | 26 Jun 2025 |
|---|---|---|
| North field | 0.52 | 0.31 |
| East meadow | 0.56 | 0.57 |
| South orchard | 0.50 | 0.59 |
All values are made for this preview. They are not measurements of real locations.
The sample shows a lower greenness reading at North field. That could guide an inspection; it cannot explain the cause.
Greenness is a reflectance proxy. Weather, management, soil and observation quality all need context. It does not establish crop health, disease or yield.
Measurement background: NASA: vegetation indices. These sources explain the science; they are not the source of the synthetic values.
What makes a result checkableFrom your question to a usable result
You should not have to assemble datasets, scripts and GIS tools for every task. The workflow brings data selection, analysis and results into the same project, with decisions you can review.
Tell the assistant what you want to compare, measure or investigate, and how you will use the answer. Bring a location, your data or an existing project.
Get help matching the task to observations with suitable dates, detail and coverage. Combine them with your site boundaries and field records where needed.
See the method, inputs, expected output and any costs. Adjust the scope in plain language before authorizing paid work.
Review a map, chart or table with its sources and limitations. Use it in a report, save the analysis for reuse or turn the task into an app.
Results you can explain
When a client or colleague asks about a finding, open the observations and method behind it. Keep the dates, usable coverage and limitations with the result so others can review your work.
Read our approach to evidenceSource, acquisition dates, resolution and usable coverage.
The analysis, inputs, parameters and recorded result.
Supported findings, uncertainty and the questions that need local knowledge.
Choose how to use your analysis
Ask the assistant which data fits your task or how to interpret a result. Resolve the question before choosing whether more analysis is needed.
Meet your AI assistantGet the map, chart, table or report needed for a site review, comparison or client deliverable. Keep the sources and method available with it.
Build a custom app around a recurring analysis so you can review sites and explore results through familiar controls.
Explore App BuilderUse your field notes, measurements and site history to interpret observed changes. A satellite measurement can help identify what to investigate; local evidence helps explain why it happened.
Bring a real analysis task
Tell us about your sites, available data and the result you need. Help us build an analysis workflow you can use without specialist setup.
Share your question