Find the site you need
Use the map and site list to locate a property, field or asset and open the observations available for it.
Milkypad Studio
Studio is the workspace for GIS apps shaped around your tasks. Review sites, compare results and plan follow-up work through maps, charts and filters—without running GIS commands or asking the assistant for every action.
Try the sample GIS app below. It uses prepared records and schematic maps.
Select a site to connect its map, chart and evidence.
| Observation date | NDVI |
|---|---|
| Apr 12 | 0.28 |
| Apr 27 | 0.35 |
| May 12 | 0.52 |
| May 27 | 0.60 |
| Jun 11 | 0.48 |
| Jun 26 | 0.31 |
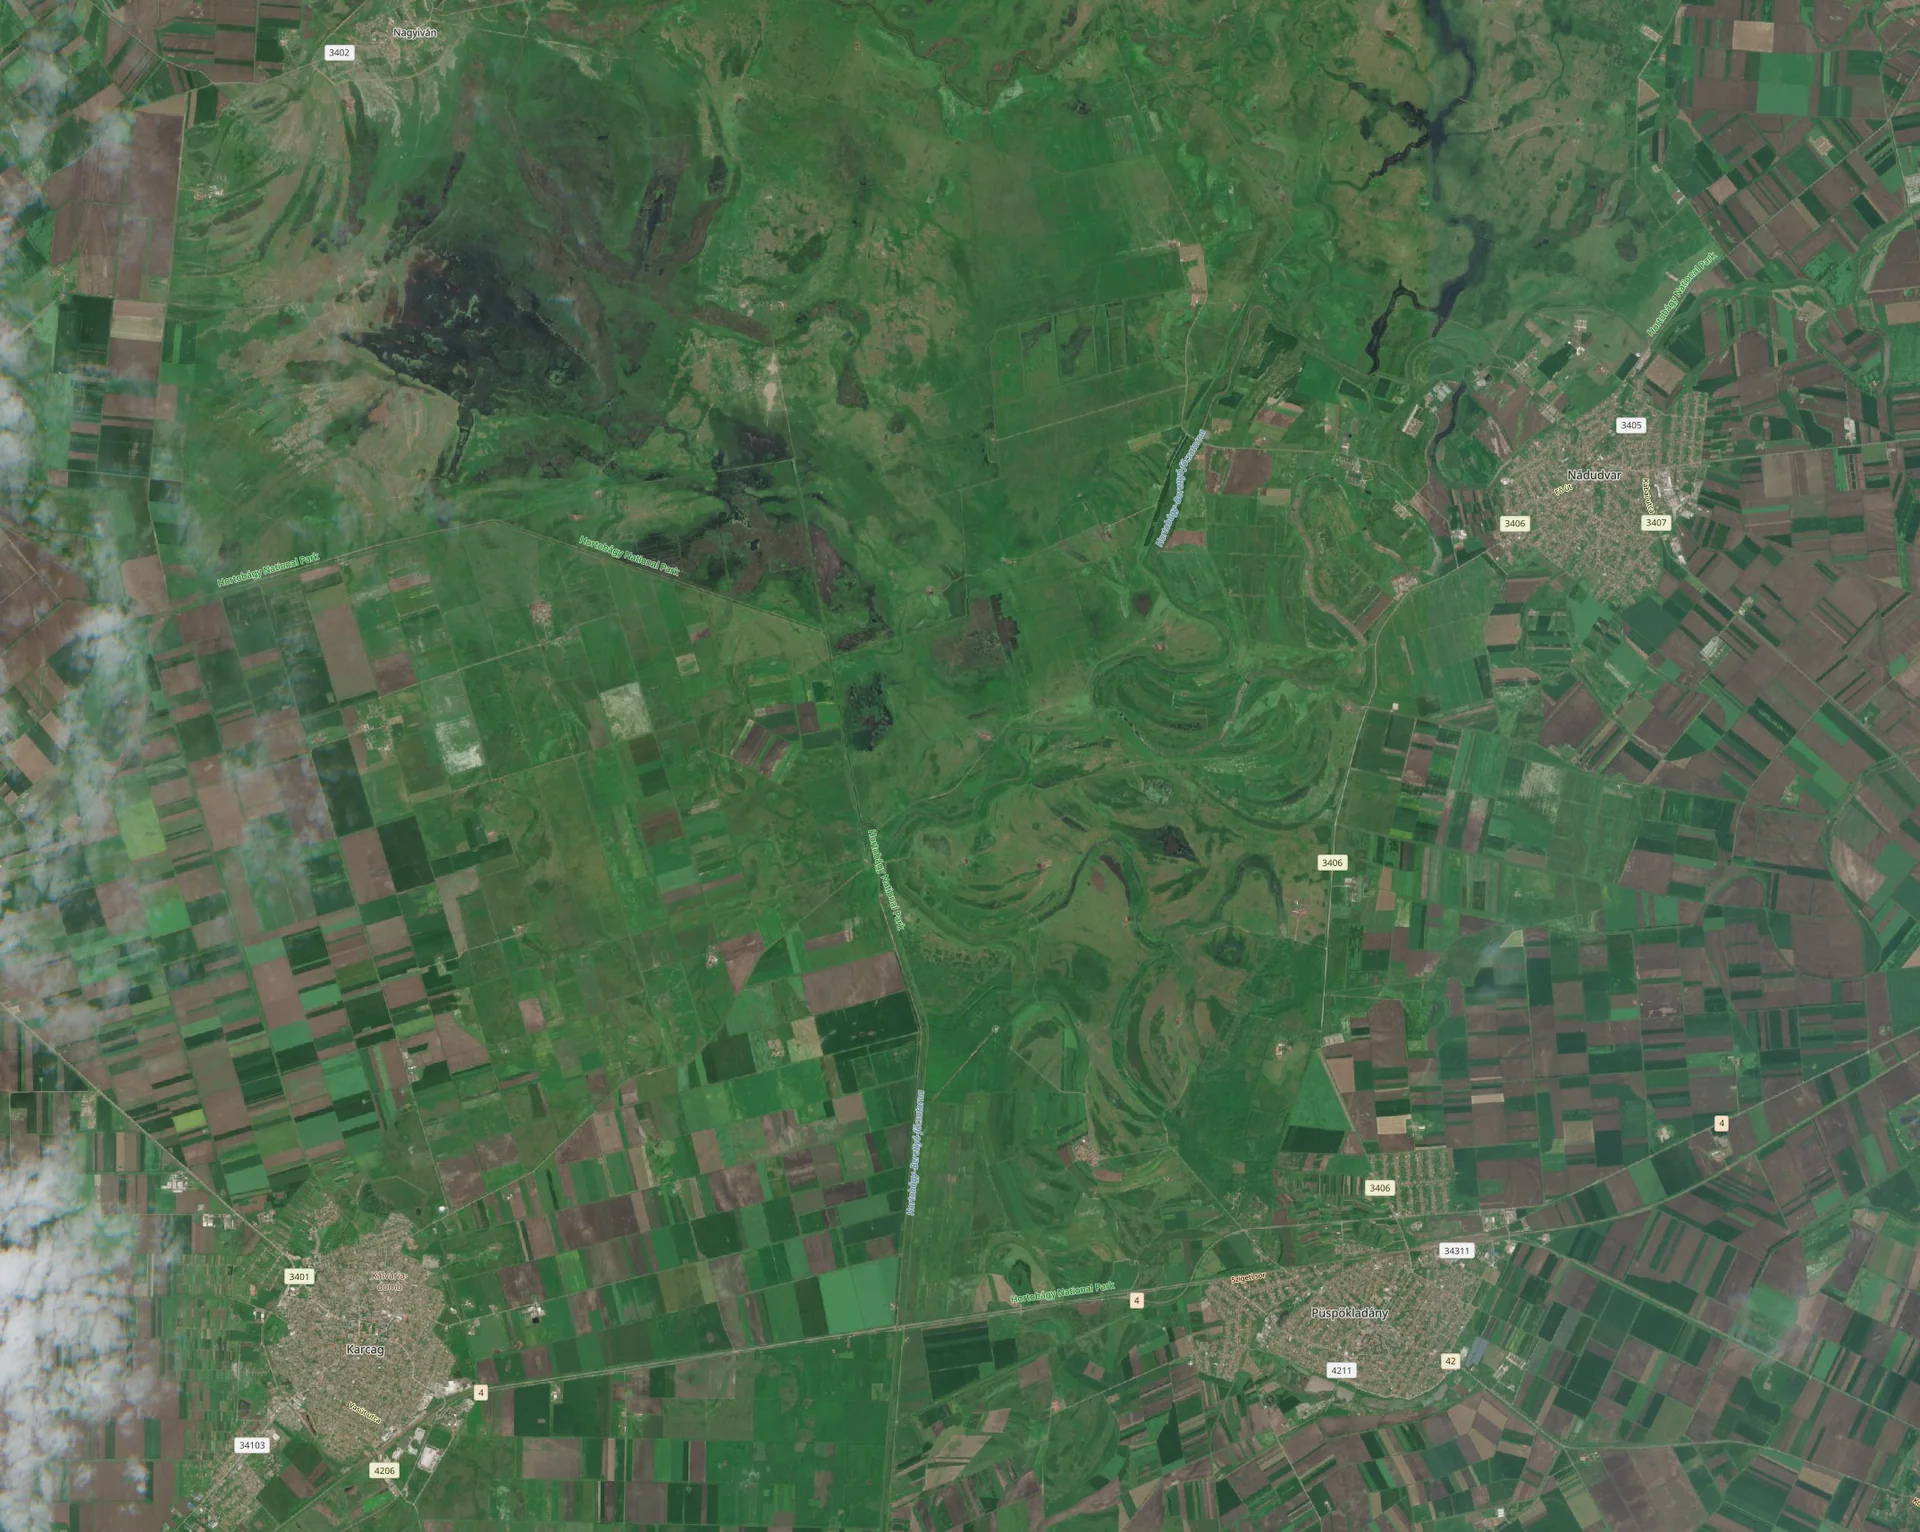
NDVI (Normalized Difference Vegetation Index) compares reflected red and near-infrared light to describe vegetation greenness. These invented values explain the controls; they were not calculated from the image. How to read satellite observations ↗
A visible drop is a reason to look more closely. It does not identify a cause.
“Add a place for field notes so I can keep my observations beside the satellite result.”
Review a proposed change, see what it adds and keep the previous version within reach.
Two prepared examples. This preview does not generate or save an app.
Review recent field activity before interpreting the drop.
“The north corner was cut last week. Check again after the next clear observation.”
Example field note · 28 Jun 2025This hands-on concept uses fictional sites and synthetic observations. It shows how a Studio app could work, without running an analysis.
Put your analysis to use
Bring observations, analysis results and your own records into a view designed for the task. Find the relevant site, inspect its history and decide what to investigate or report.
Use the map and site list to locate a property, field or asset and open the observations available for it.
Select a site to see its chart, records and analytical results together. Check dates and missing observations before interpreting a change.
Use a review list to plan inspections or a reporting view to explain findings. Keep field notes beside the satellite results that prompted the task.
Use the app directly
Once an app is built, return to it for everyday work. Change a filter, explore a table or inspect a result through its controls while the assistant is idle.
When you need more, ask the assistant for another analysis or a change to the app. Continue from the data and results you already have.
See the full platformFrom a site list to a decision
Return to an app and the recorded results it uses.
Filter the site list and connect the map, chart, and table around the place you need to review.
Check observation dates, coverage, and limitations before deciding what an apparent pattern means.
Use the finding for an inspection or report. Ask App Builder for a new view when the task calls for one.
Explain findings to your team
Studio apps are designed to show which observations and analyses their results use. When a colleague needs to check a finding, the dates, method and limitations should be available alongside it.
Explore our approachBuild the tool for your task
Explore how App Builder turns a plain-language description into a custom map, dashboard or review tool for Studio.
Explore App Builder