Real satellite observations help illustrate what Earth data can reveal. Here are the people, sources, and image details behind the views you see on our website.
These RGB visualizations provide context for our example workflows. They are not quantitative raster products or outputs from a live Milkypad analysis.
Maps, boundaries, charts, and app records layered over them are prepared illustrations. Website layouts may crop the visible image area to fit your screen.
The image collection
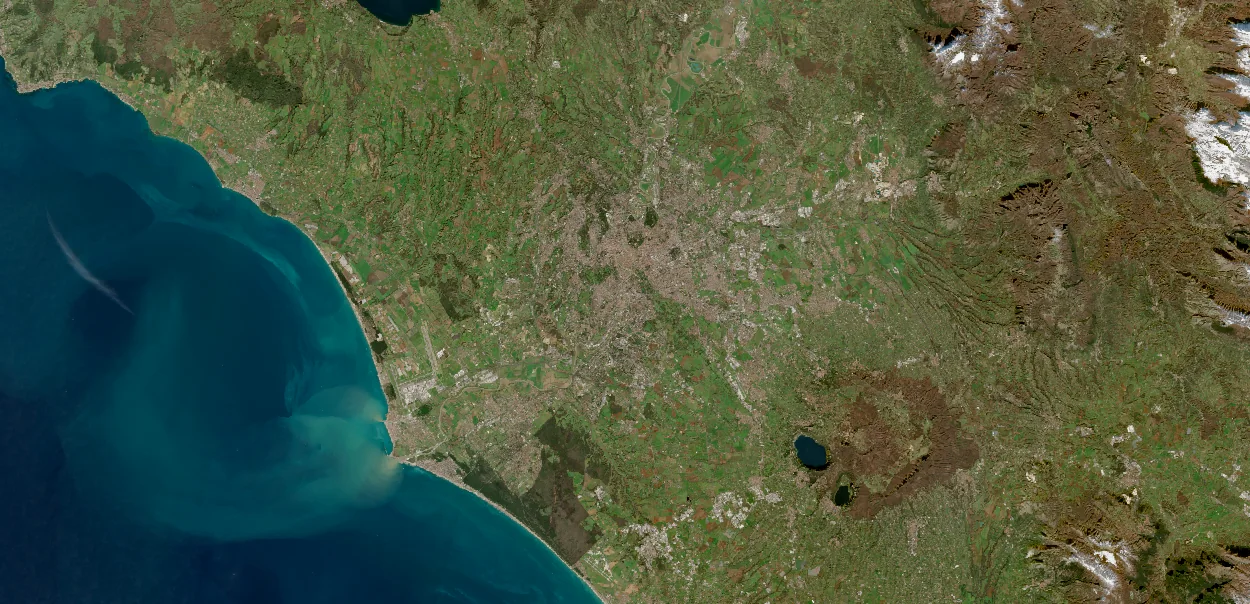
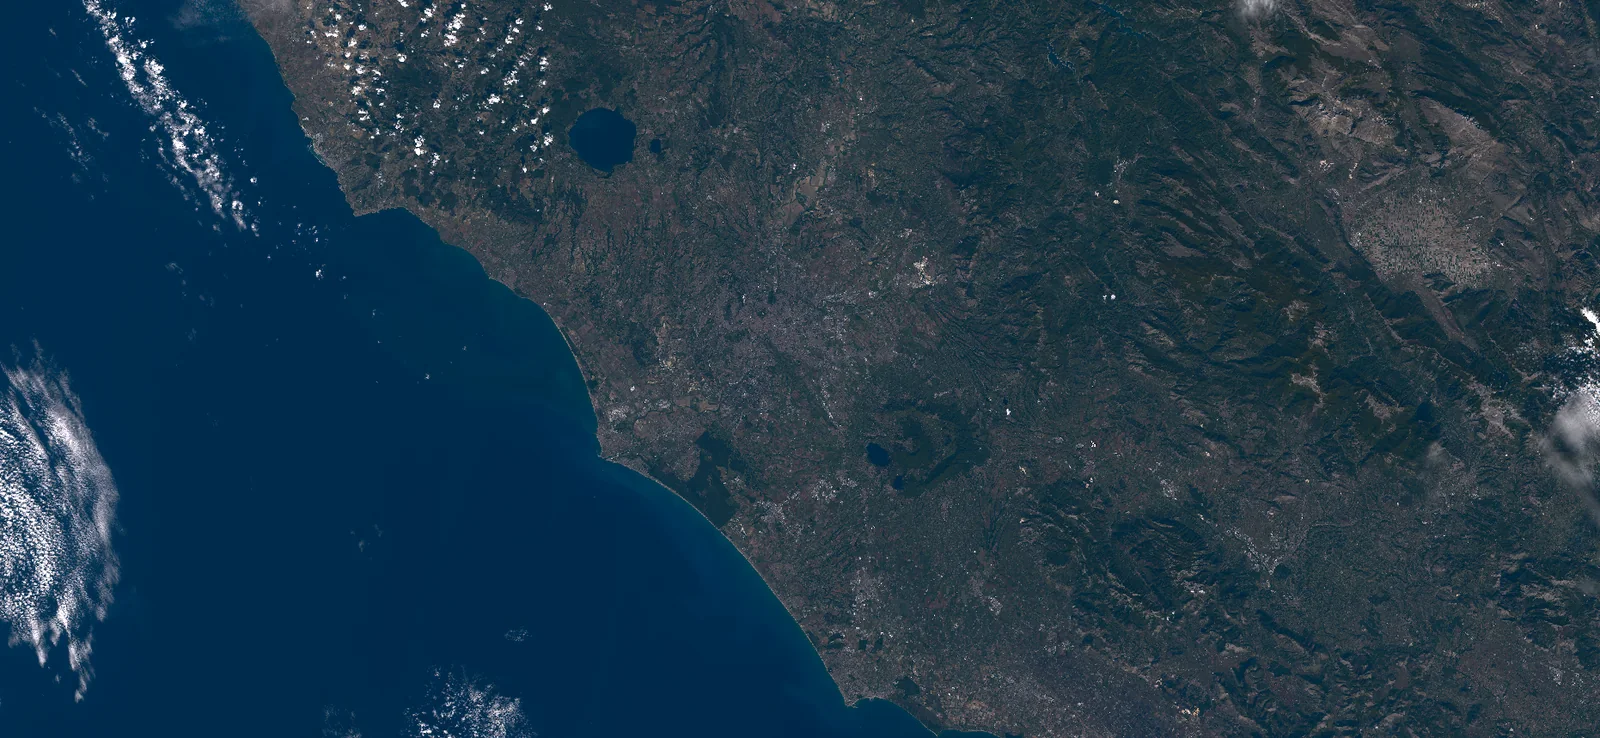
Three views of Earth.
Each source link points to the exact repository snapshot used for the image.
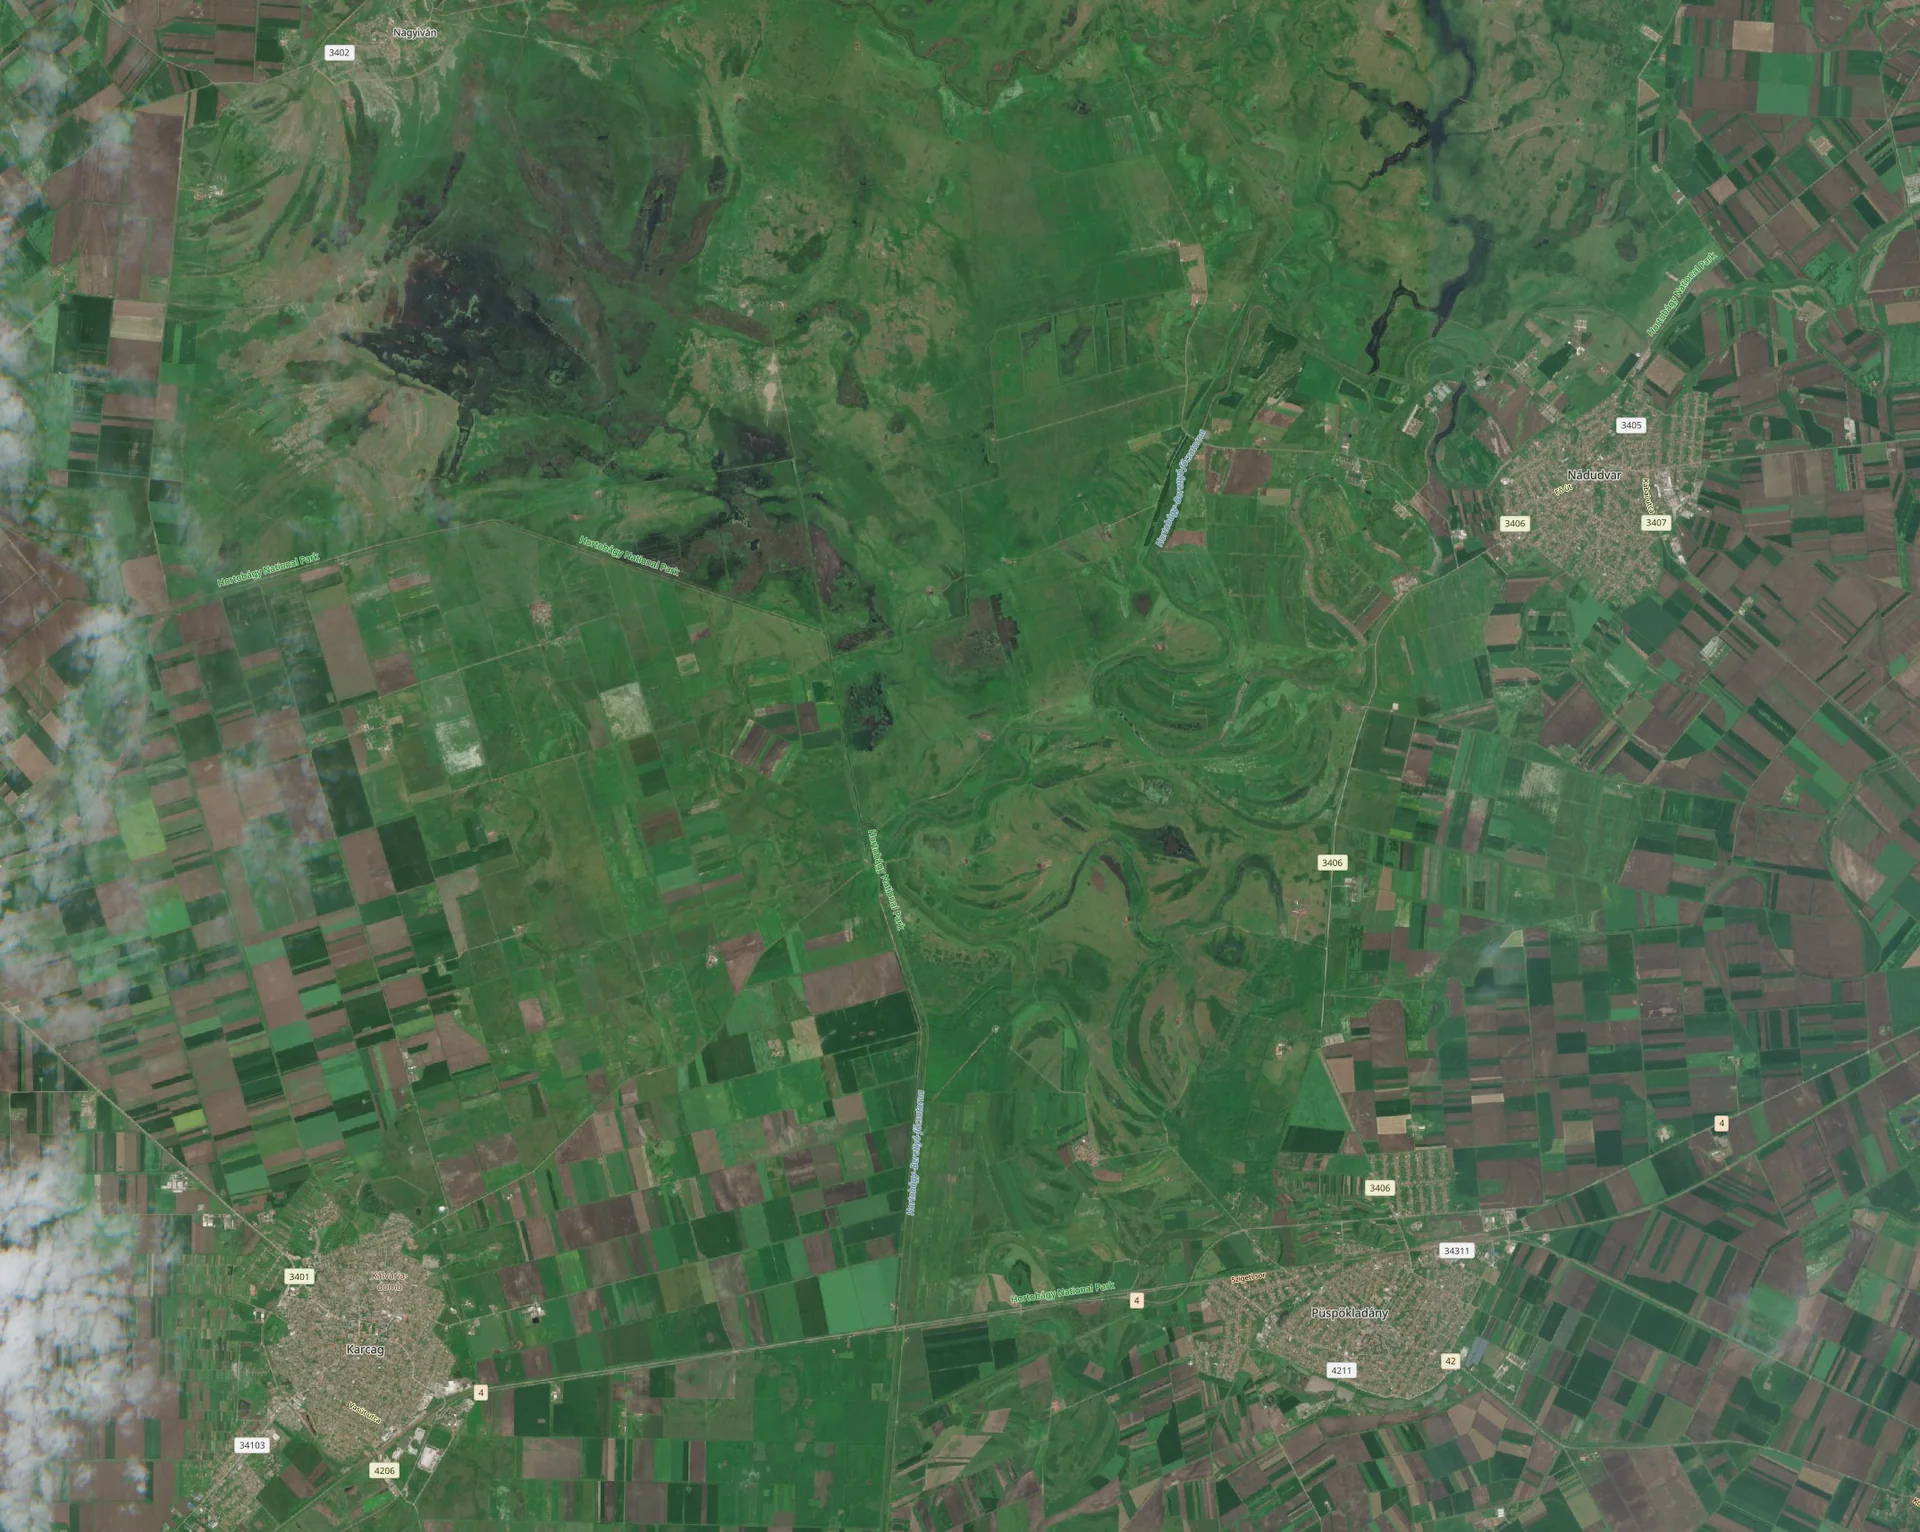
Near Püspökladány, Hungary1920 × 1532
01 / Sentinel-2 imagery
Grasslands and crop fields in Hungary
A natural-color Sentinel-2 image from the kernel NDVI example. Old river channels cross the grasslands between cultivated fields.
Website file
earth-farms.webp
Image changes
Resized from 2148 × 1714 to 1920 × 1532 pixels and converted to WebP. Responsive website copies are also supplied at 280, 560, 960, and 1440 pixels wide.
Capture date
The upstream description and image alt text disagree on the capture date, so we do not assign one here.
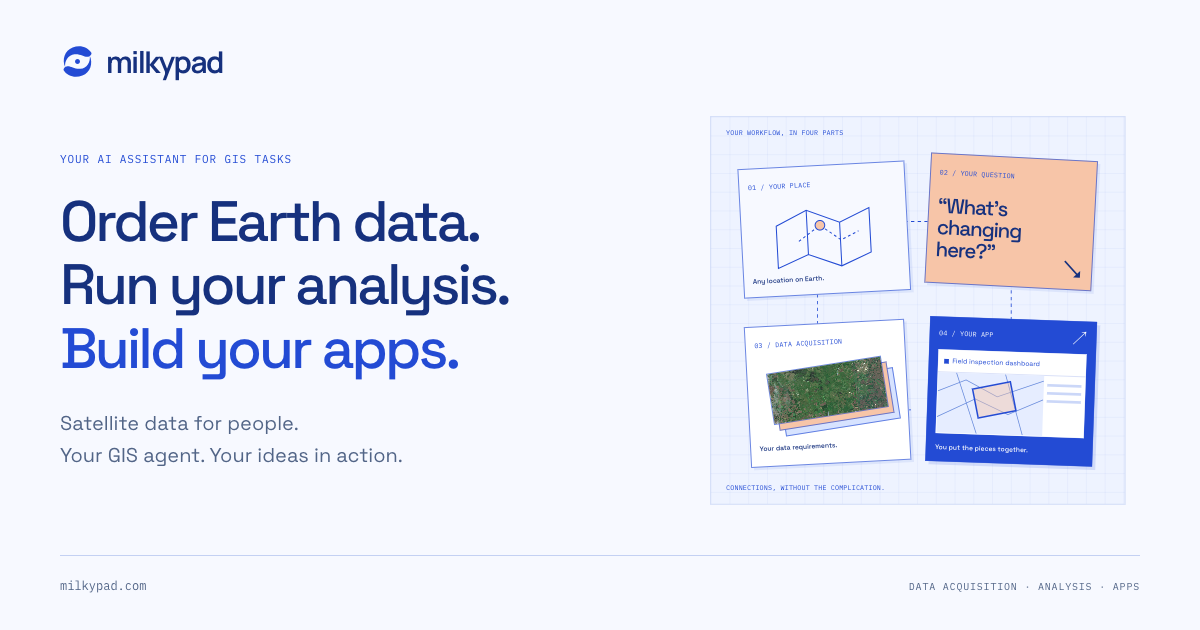
The Blueprint graphic combines a layered crop of the Hungary satellite image with a schematic workflow: a location, a question, data acquisition, and a custom app.
It includes Milkypad’s Milky Current symbol, the approved Manrope wordmark, and Space Grotesk / IBM Plex Mono typography. The diagram is illustrative artwork, not an analysis result.
Website file
social-card.png
Image credit & license
Copernicus Sentinel data, visualized by Sentinel Hub and the Sentinel Hub Custom Scripts contributors. This adapted graphic is distributed under CC BY-SA 4.0.
With your permission, Google Analytics helps us understand page visits and count successful enquiries. We don’t send your form answers or use analytics for personalized advertising.