Compare sites, plan field visits, prepare reports and build tools for your team. Explore how satellite data acquisition, AI-assisted analysis and custom apps fit together, without needing to become a GIS specialist or write the code yourself.
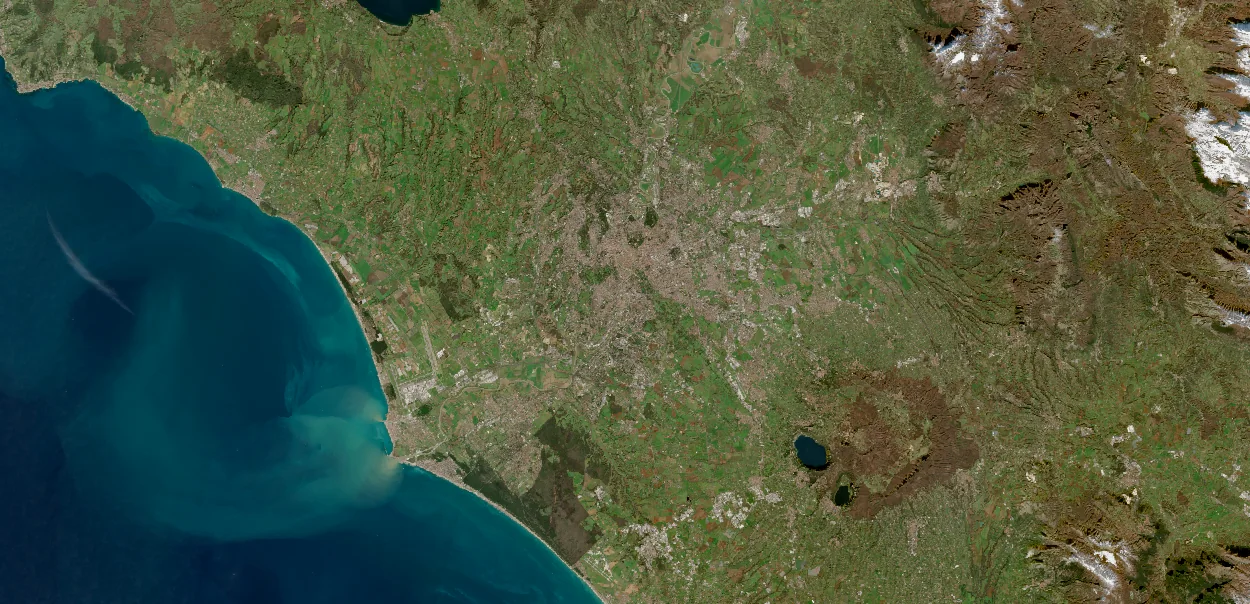
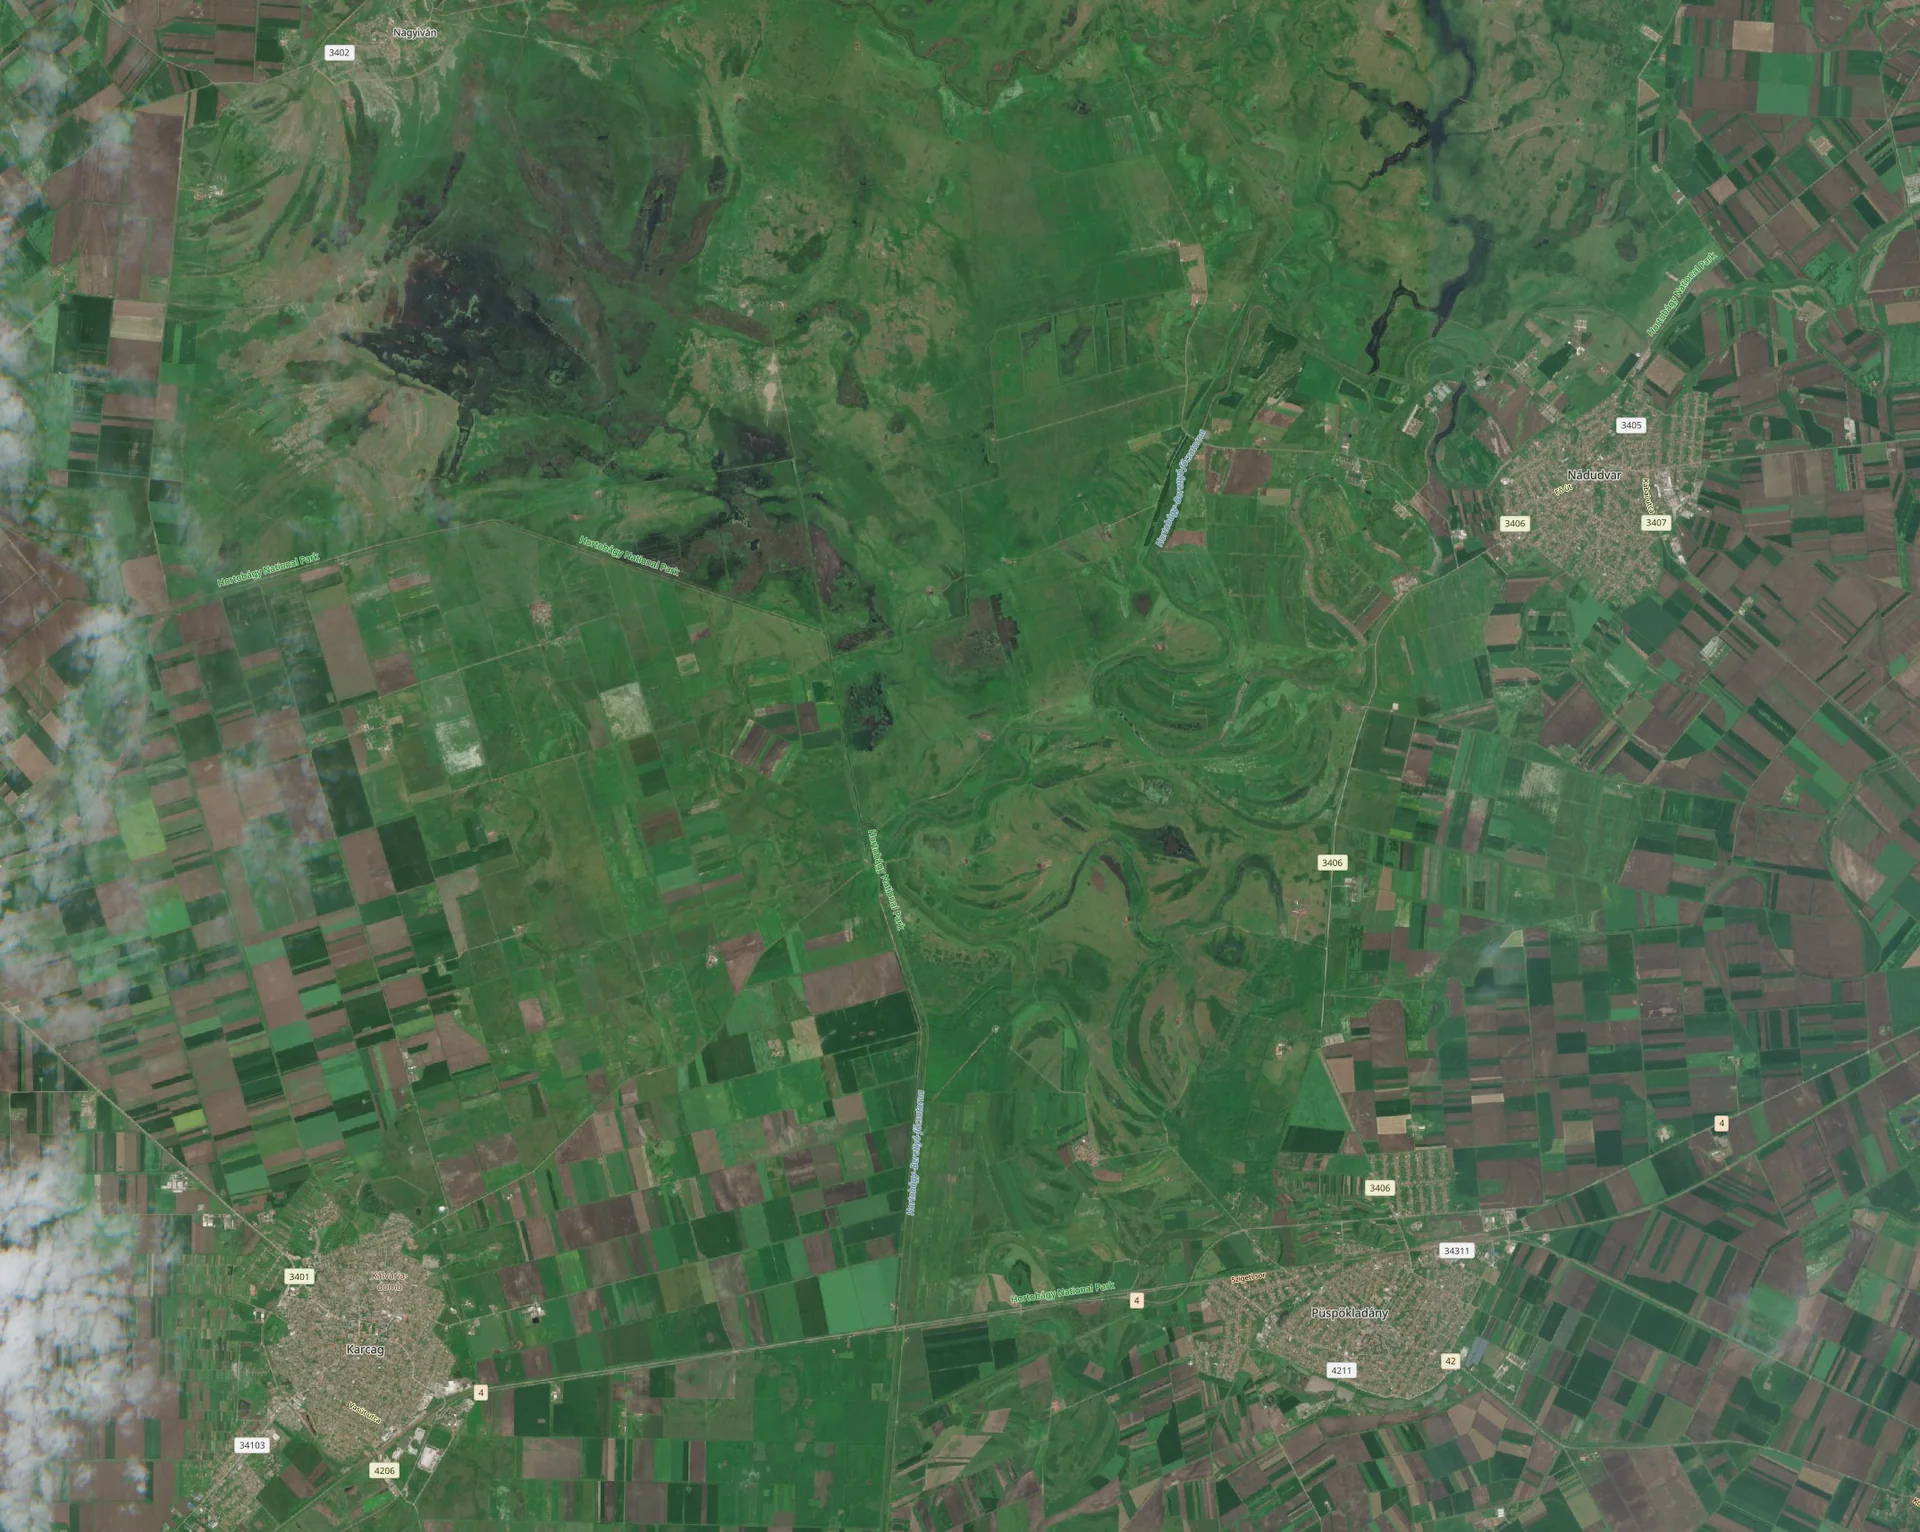
Sentinel-2 imagery of Italy and Hungary provides context for these example workflows; it does not show a Milkypad analysis or customer project. Image credits.
Find a task like yours
What do you need to get done?
Explore GIS workflows across land, water, cities and research. Each starts with your question and the data and methods suited to answering it.
11 use cases · example workflows
01Agriculture & land
Decide which fields to visit first.
Compare seasonal satellite observations with your field boundaries and notes. Turn unusual patterns into a scouting list your team can use.
Who it’s for
Agronomy advisers, farm groups and land managers
What you could create
Field comparison app, seasonal charts and visit priorities
Use field checks to establish the cause of a flagged pattern.
Bring vegetation observations, intervention dates and field records together. Review each site over time and prepare monitoring reports from the same project.
Who it’s for
Ecologists, forestry and restoration teams
What you could create
Site histories, comparison maps and monitoring reports
Combine satellite indicators with field evidence when assessing ecological recovery.
Compare land-cover or surface-temperature observations across neighbourhoods. Combine them with local boundaries and prepare maps for planning discussions.
Who it’s for
Planners, researchers and public-interest teams
What you could create
Neighbourhood comparisons, planning maps and shareable summaries
Keep surface temperature distinct from air temperature and observations distinct from legal status.
Connect observations to your asset IDs and inspection history. Build a portfolio view where colleagues can select a site, review a change and plan a follow-up.
Who it’s for
Multi-site operators, engineers and asset managers
What you could create
Portfolio dashboard, inspection queue and linked site records
Use the review to direct inspection; structural safety requires qualified assessment.
Compare suitable spectral or terrain data with geological maps and reference samples. Create an app for inspecting candidates and preparing field investigations.
Who it’s for
Geoscientists and specialist environmental teams
What you could create
Material screening maps, spectral comparisons and sampling lists
A spectral match guides investigation; grade and deposit claims require further evidence.
Describe your objective, bring your datasets and ask the assistant to help find suitable sources and methods. Turn useful results into an app colleagues can operate.
Who it’s for
Researchers, domain experts, GIS specialists and teams
What you could create
Custom analyses, datasets, reports and reusable applications
Review the method and reference evidence before using a result to make a claim.
With your permission, Google Analytics helps us understand page visits and count successful enquiries. We don’t send your form answers or use analytics for personalized advertising.