Describe your site and question
Bring a site boundary, choose the periods to compare and explain what the report needs to show. Use your own words to tell the assistant what you want to investigate.
Your site · your dates · your reporting questionFor consultants & project teams
Move from a site question to a comparison map, analysis and client report in one workflow. Explore how an AI assistant for GIS can help with the work, without requiring you to learn specialist software or write analysis code.
Compare dates.
Review changes.
Share the result.
What goes into the report
The named site, boundary and area you reviewed
Source images, capture dates and usable coverage
Supported measurements and how they were calculated
Annotations, limitations and recommended follow-up
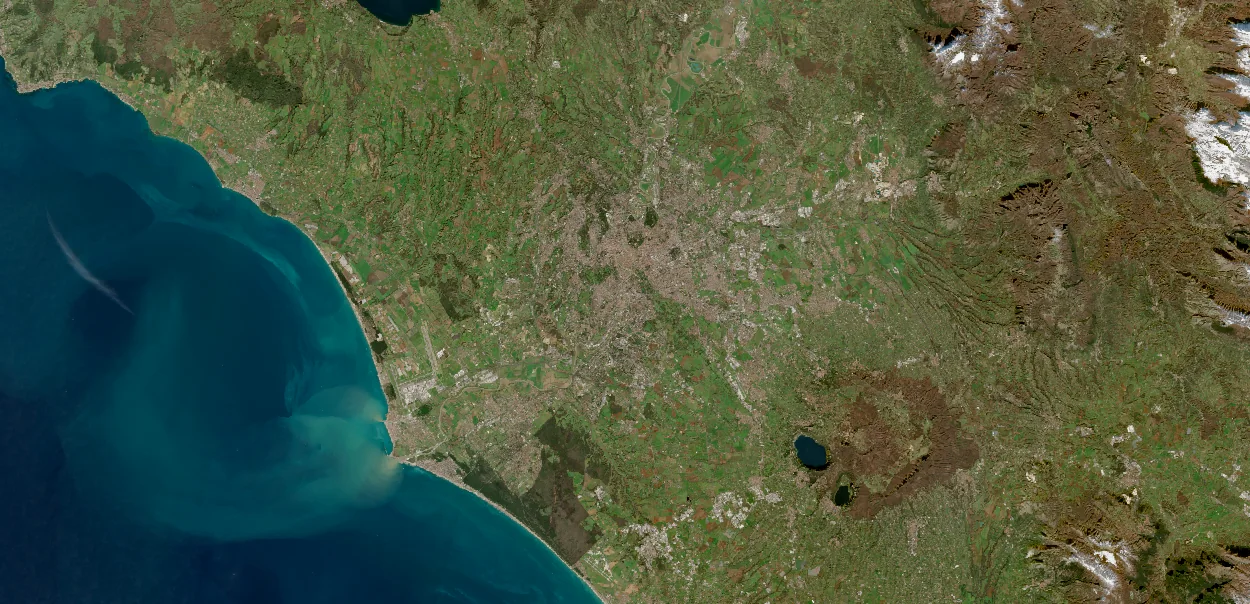
Illustrative report structure; no live change analysis is shown. Satellite image credits.
One workflow for the complete task
Bring your domain knowledge. Milkypad’s assistant helps with data selection and analysis so you can focus on what the result means for your client.
Bring a site boundary, choose the periods to compare and explain what the report needs to show. Use your own words to tell the assistant what you want to investigate.
Your site · your dates · your reporting questionGet help choosing observations with the coverage and detail your task needs. Keep the relevant dates and site records together instead of preparing separate files for each step.
Satellite observations · site boundaries · local recordsCompare supported changes, inspect the map and site summary, then add your interpretation. Review the source dates and missing coverage before deciding what belongs in the report.
Comparison map · site summary · review notesBring the maps, measurements and explanation into a deliverable for your client. If the task repeats, create an app with the site and date controls your team needs.
Client report · data export · reusable appScale changes the question
“What changed?” can mean very different things. The smallest relevant feature helps determine whether a source is suitable.
Make the next project easier to start
When the same comparison comes back each month or for another site, an app can put the routine in your team’s hands. Choose a site, select dates, review the results and prepare the next report through familiar controls.
Ask the assistant to add the filters, charts or report views your work needs. Customise the tool in ordinary language, then use it directly in Studio.
Explore App BuilderStart with a real deliverable
Tell us about the site, the period you need to compare and what your recipient needs to understand.
Discuss your workflow