How to Find Historical Satellite Images of Any Address, by Date
Search historical satellite archives with a clear location and time window. Compare usable observations, distinguish capture dates and keep gaps honest.
 View full-size image ↗
To find historical satellite images, define the location, choose the relevant date window and search an archive that covers that period. Then inspect the actual candidate observations. A catalog result is not proof that the place is visible, and a requested calendar date does not guarantee that a satellite captured a usable image that day.
Historical research works best when the time requirement comes from the question. “Before construction began,” “during the same growing season” and “closest to a particular event” are different searches. State the relationship you need before selecting the most attractive image.
Begin with the event or comparison question
Write what you are trying to establish and what an image could reasonably show. A visible building footprint, a broad change in vegetation or a shoreline position can support a visual comparison. The image alone may not establish ownership, permission, the cause of a change or conditions hidden beneath a surface.
Set a preferred capture date and an acceptable window around it. If the exact date is essential, record that constraint and be prepared for no result. If nearby dates are acceptable, define how far the search may expand and why. Do not quietly widen the window until something convenient appears.
For before-and-after work, define both periods separately. The most recent image before an event is not necessarily a suitable baseline if it represents a different season or unusual conditions. A slightly older but more comparable observation may support the intended measurement better, provided the timing limitation is clearly stated.
Choose an archive with the right history
The USGS Landsat Collection 2 overview describes an archive extending back to the early Landsat missions, with product availability varying by sensor and processing level. This makes it useful for long-term questions, but it does not mean every location has an equally complete sequence of usable observations.
For more recent Sentinel observations, the Copernicus Browser supports searching, visualizing and downloading data. Commercial archives can provide other spatial detail or dates. Select the archive according to the period, measurement and feature size; no single portal is automatically the right source for every historical question.
When checking a catalog, distinguish the mission’s overall operating period from availability of the specific product you need. A processed collection may begin later than the sensor record or have geographical gaps. Record the collection and product level with your search results so a colleague can reproduce the query.
Search the exact area, then inspect its context
Draw the AOI and verify it on a reference map. Include relevant surroundings if they help interpret change, such as upstream land, connecting roads or nearby development. Keep the analytical boundary consistent between dates unless there is a documented reason to change it.
Start with a reasonable time window and quality filter. Then inspect the candidates over the AOI rather than trusting a whole-scene cloud percentage. A broad scene can be mostly clear while the small site is hidden. Conversely, a cloudy scene may contain a useful clear view of the site.
Save the search parameters, candidate identifiers and rejection reasons. This may seem excessive for a simple comparison, but it prevents selective use of only the images that support an expected story. A transparent candidate list shows what evidence was available and why the chosen observations were considered suitable.
Read the time fields carefully
Use acquisition time to describe when the ground was observed. Processing, publication and download timestamps describe other events in the data’s life. Reprocessed historical imagery can have a recent file date without representing a recent view of the location.
Be especially careful with mosaics and composites. A seamless image may combine observations from several days or longer periods. If you need evidence about one event, a visually continuous map can conceal the fact that different locations were observed at different times. Request or retain source-date information where it matters.
If a catalog provides only a broad temporal description, do not invent a precise capture date. Explain the uncertainty in the output. A report that clearly says “observations within this interval” is more defensible than one that assigns a single date because the map layout has room for only one label.
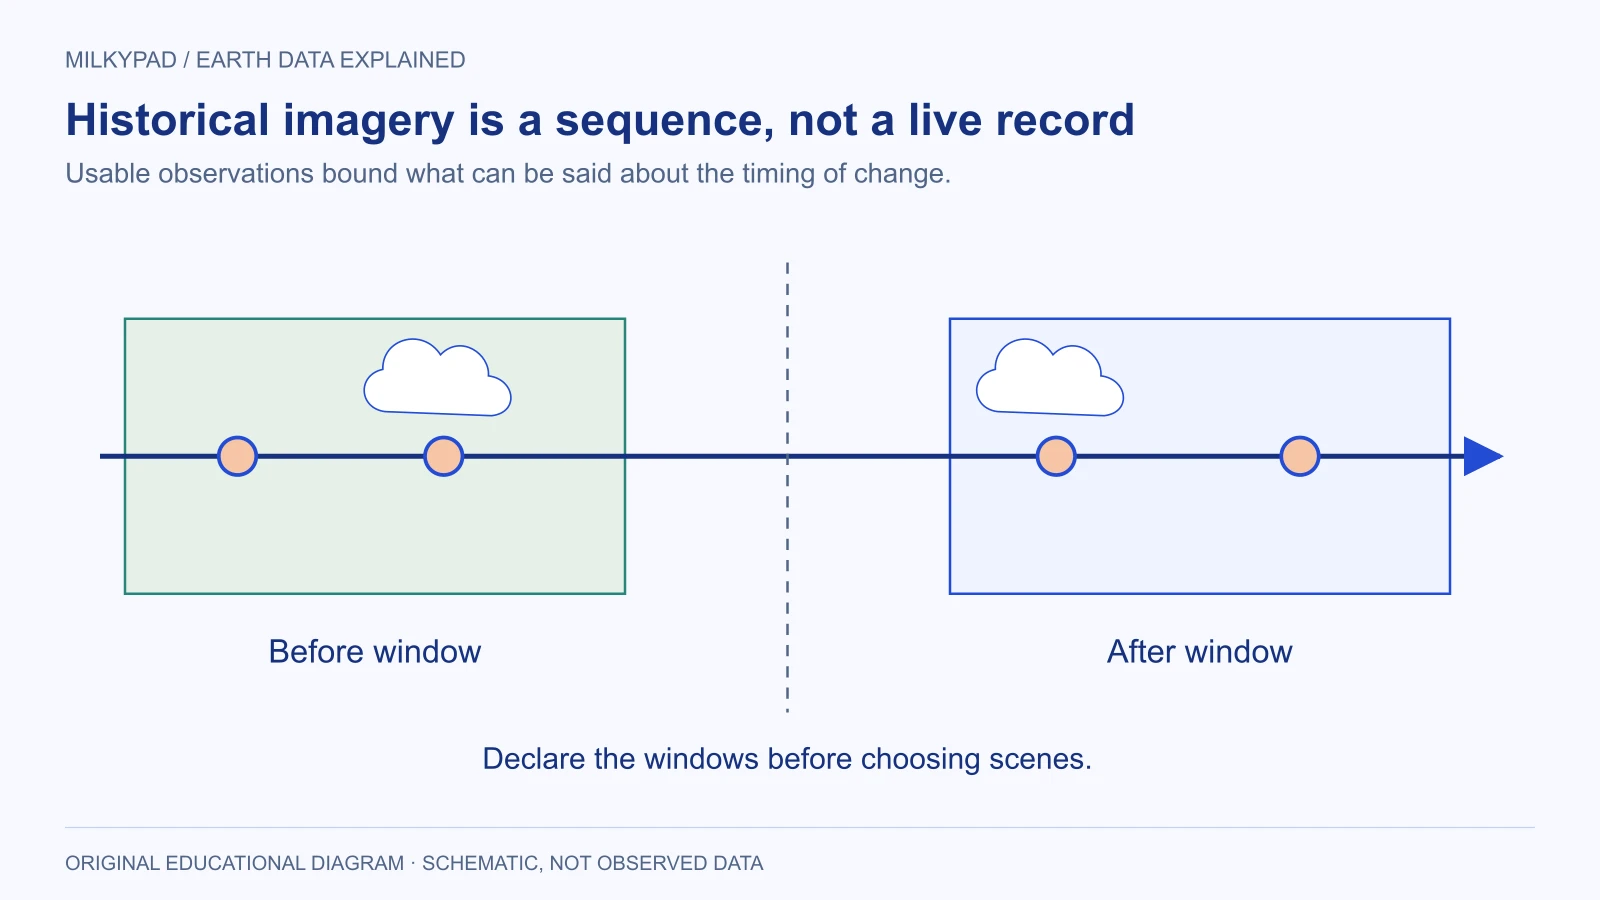
The selected observations fall within declared windows. Rejected and missing dates remain visible rather than disappearing from the evidence record.
A hypothetical construction-history search
Imagine a community research team asking when a large warehouse first became visible on a site. This example is fictional and does not establish a legal or planning conclusion. The team knows a broad period of interest but has no reliable exact construction date.
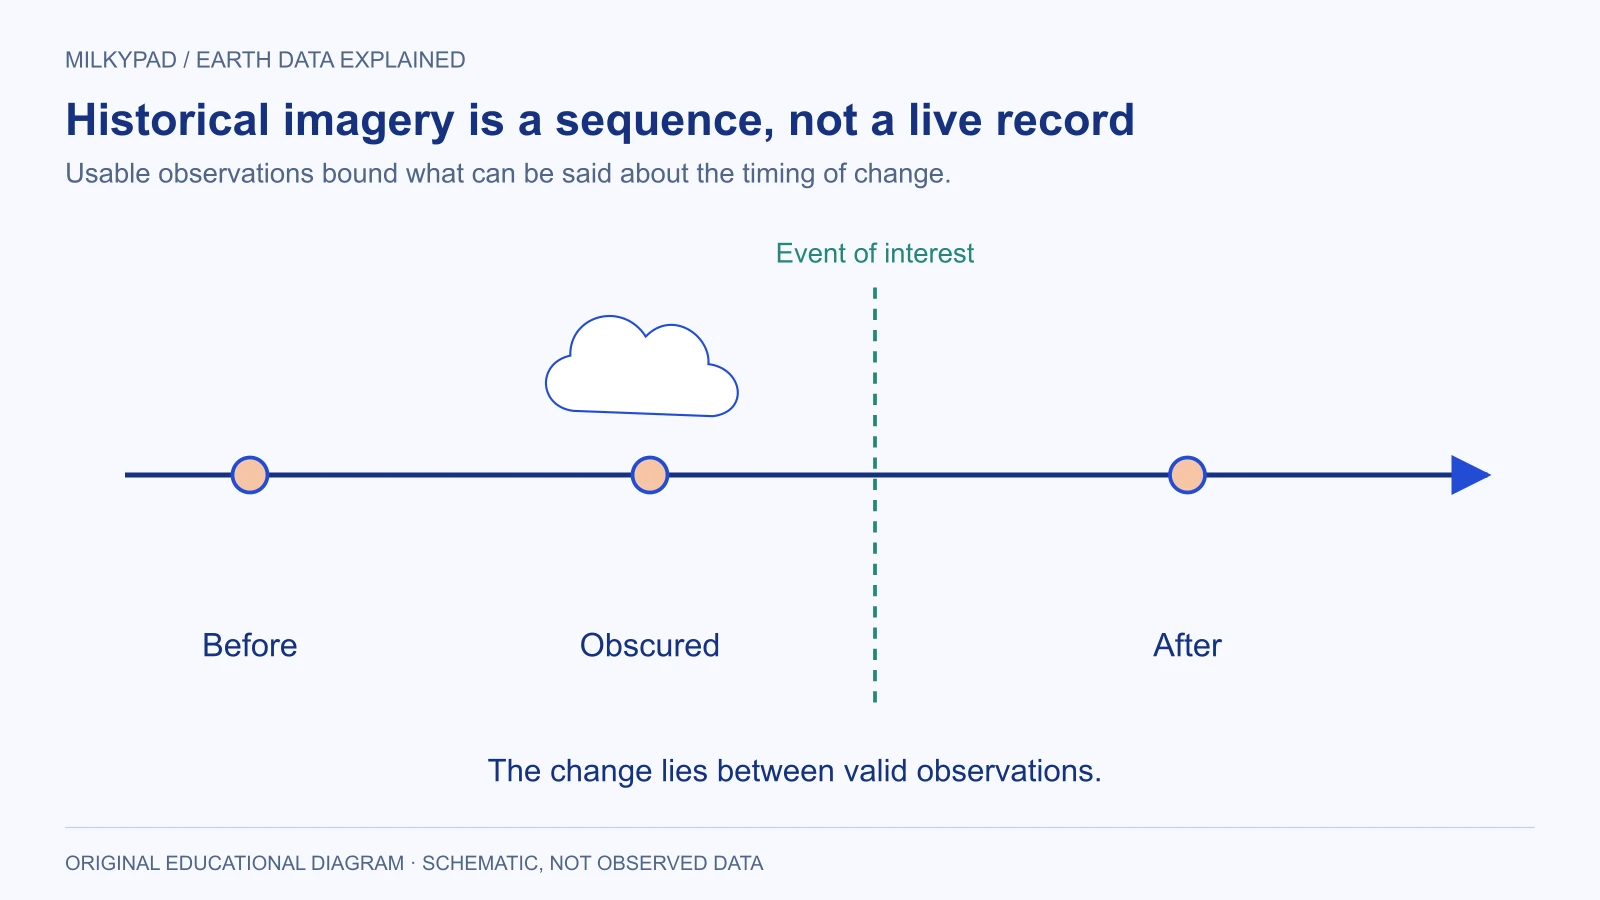
It searches several windows and finds one clear observation with no visible large roof, a later cloudy observation, and another clear image showing a completed-looking roof footprint. The valid conclusion is that the visible change occurred between the two usable observations. The cloudy middle date does not narrow the interval.
The team then checks whether viewing geometry or image detail could explain the difference. It inspects stable roads and neighboring structures, confirms the AOI, and records the limitations of the earlier image. It avoids claiming an exact start date or inferring the building’s internal completion from the roof alone.
In the published comparison, both capture dates are prominent and the uncertainty interval is stated in words. The team includes independent planning records where available and keeps them separate from the imagery evidence. The result answers a modest question honestly rather than turning a pair of pictures into an unsupported chronology.
Make comparisons visually and analytically fair
Use consistent map extent, orientation and scale when presenting before-and-after images. Label differing acquisition conditions. If you adjust display contrast, avoid making one date appear unusually dramatic through inconsistent rendering. Preserve the source data and document the visualization choices.
For numerical change analysis, additional preparation may be needed: appropriate product levels, quality masks, compatible units and spatial alignment. Copernicus Sentinel-2 product documentation distinguishes top-of-atmosphere and surface-reflectance products. A visual similarity does not guarantee that two downloaded files are directly comparable measurements.
| Evidence item | Keep it with the comparison |
|---|---|
| Search definition | AOI, date windows and selected collection |
| Candidate record | Scene identifiers and reasons for exclusion |
| Observation time | Capture timestamp or documented interval |
| Quality | Clouds, shadows, missing coverage and other limitations |
| Preparation | Masks, alignment, units and display choices |
| Interpretation | What changed visibly and what remains unknown |
Know when the archive cannot answer
Sometimes no suitable observation exists for the period or feature. A broader window, another sensor or independent records may help, but each changes the evidence. State the revised question explicitly. Do not fill a historical gap with a present-day image or treat interpolation as an observed event.
For a future monitoring plan, the gaps you discover can inform acquisition requirements. You may decide to preserve regular observations, keep source identifiers or schedule reviews before the next important period. Historical research often reveals why observation planning matters long before a dispute or decision arises.
Milkypad’s data acquisition work is intended to connect location and timing requirements with suitable Earth data. Send your event, AOI and acceptable windows when you ask for a price. The useful answer may be a set of candidate images with their prices, a carefully bounded comparison or a clear explanation that the archive cannot support the requested claim.
Further reading
- Landsat Collection 2 — USGS.
- Copernicus Browser documentation — Copernicus Data Space Ecosystem.
- Sentinel-2 processing levels — Copernicus Data Space Ecosystem.
Sources checked on 14 October 2026.
Sources checked 2026-10-14. Illustrations created by Milkypad. Diagrams and numerical teaching examples are schematic unless explicitly identified otherwise.