Live Satellite Images: Can You See Your House in Real Time?
No public service shows your house live from space. Learn what “latest” and “near real time” really mean, and how revisit, capture and delivery decide how fresh an image can be.
 View full-size image ↗
Most satellite imagery used in GIS is an observation captured at a particular time and delivered after processing, not a continuous live view of any place on Earth. “Latest,” “frequent revisit” and “near real time” describe different things. Ask for the acquisition timestamp, expected usable observation frequency and delivery latency separately.
There are specialized sensors and services with different operating patterns, so avoid treating all satellite data as one product. For a site-monitoring project, the useful question is how quickly you can obtain evidence of a relevant change, with enough detail and confidence to act on it.
Three clocks govern the answer
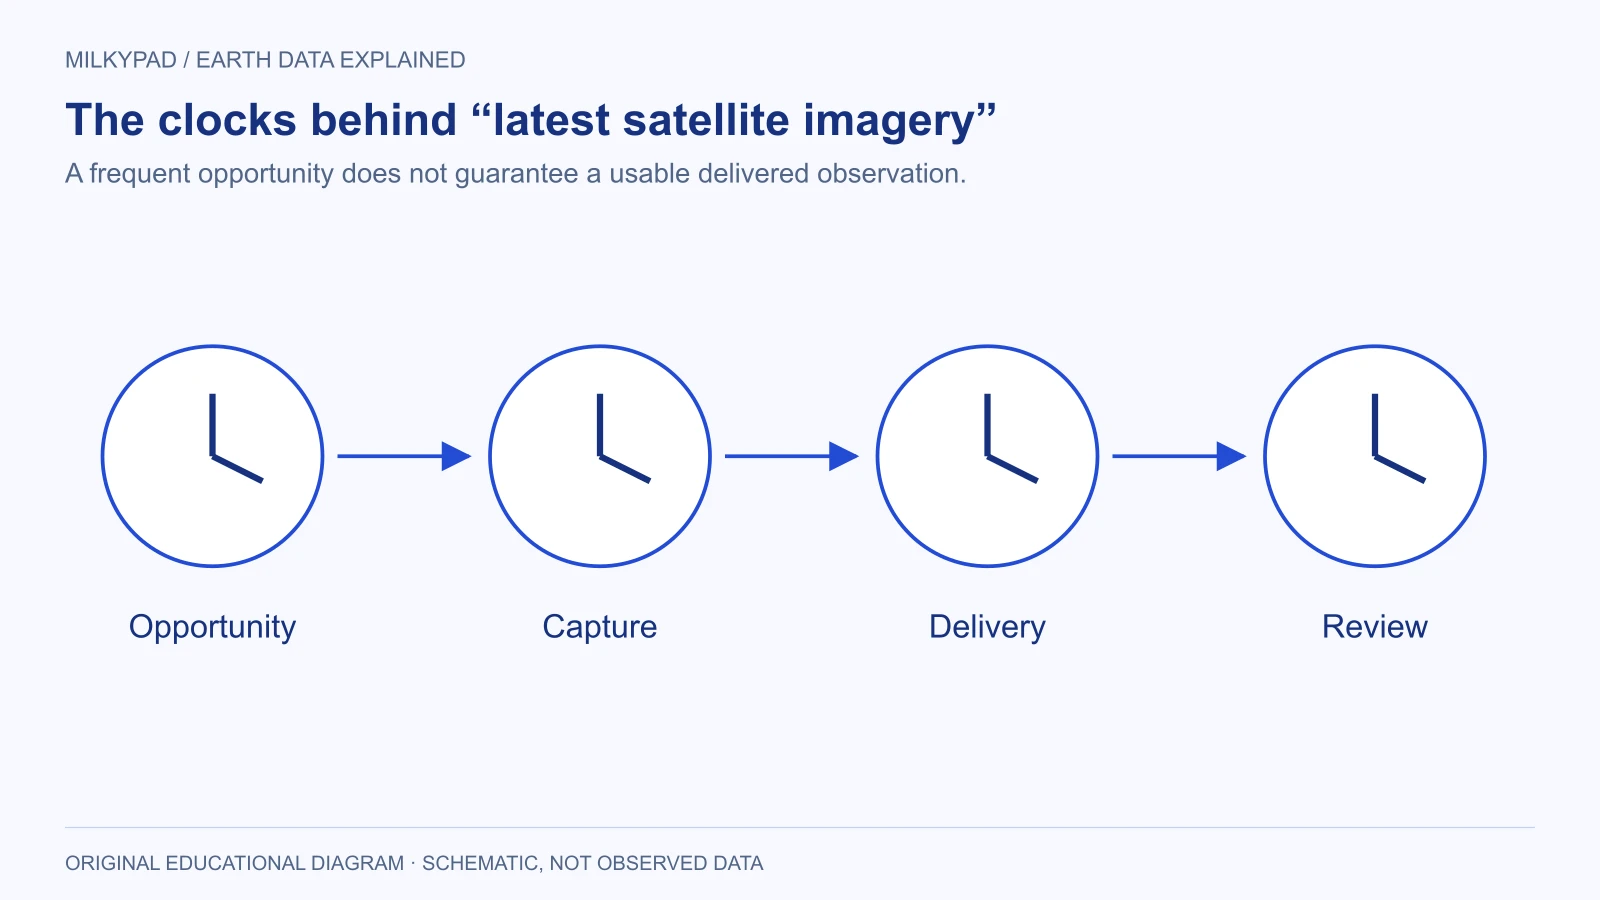
The first clock is the opportunity to observe. An orbit and sensor configuration may permit repeated access to a location. That does not mean every opportunity produces a purchased image of your AOI. Collection plans, capacity and the requested acquisition conditions also matter.
The second clock is successful capture. A scheduled optical observation may be obscured by weather. The image might exist but fail your quality conditions, or the required area might not be fully covered. A revisit opportunity therefore differs from a usable observation for your project.
The third clock is delivery. Data must be received, processed and made accessible in the appropriate product. Planet’s tasking lifecycle distinguishes ordering, scheduling, capture and delivery concepts. Use those separate stages when asking a supplier to explain timing.
“Latest” needs a timestamp
A map can display the latest image available to a particular service while that image is days, months or years old. Its freshness depends on the location, dataset, quality criteria and service update process. A recent website refresh is not evidence of a recent satellite capture.
Look for an acquisition time in UTC and a clear time-zone convention in reports. If a local event happened close to midnight, a date-only comparison can be misleading. Record the event time, image capture time and uncertainty about the sequence rather than inferring an exact relationship from two calendar labels.
Products can also be reprocessed after acquisition. A new processing timestamp may indicate improved corrections or a new product version, not a new look at the ground. Keep observation time separate from creation, publication and download times in your data model.
Delivery speed depends on the product
A quick-look image and an analysis-ready product may become available on different schedules. The USGS Landsat Level-2 documentation describes different processing timelines for products and missions. That is a practical reminder that “data available” needs a product name attached to it.
Ask which deliverable your deadline refers to: a preview, a georeferenced image, corrected measurements, quality information or a completed analysis. A preview might help confirm collection without being suitable for the calculation your team plans to perform. Avoid designing a service-level promise around the fastest preliminary artifact.
Separate provider delivery from your own processing. If the team reviews outputs once a day, reducing image-delivery latency by an hour may not change the time to a decision. Conversely, an automated pipeline can still be delayed by an unresolved quality exception. Measure the full path to a reviewed result.
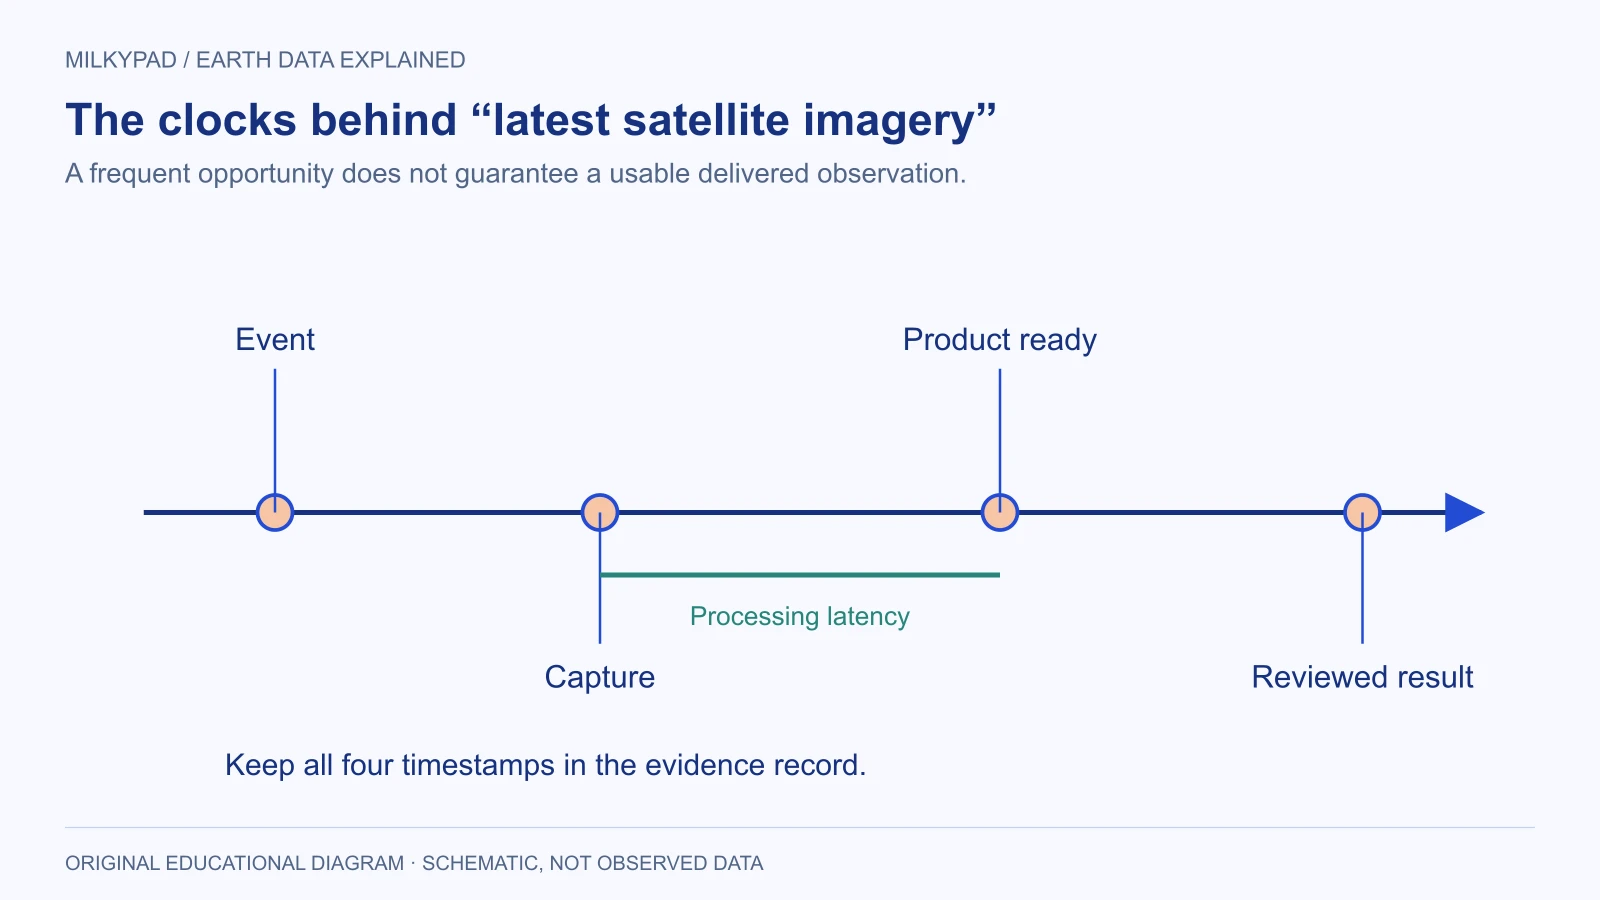
The intervals are schematic and are not promised service times. The final review stage belongs to the buyer’s workflow.
A hypothetical incident-monitoring scenario
Imagine an operations team checking whether a large storm has affected access to remote facilities. The event occurred early in the morning. The team finds a satellite image newly posted to a portal and initially assumes it shows post-storm conditions. Metadata reveals that the capture happened before the storm, so it cannot answer the immediate question.
A second optical opportunity occurs afterward, but clouds obscure one facility. The team marks that location as unobserved rather than unaffected. It considers another sensor and local reports for that site, while using the clear imagery to identify visible changes elsewhere. This is a hypothetical example, not an emergency-response protocol or evidence of actual sensor performance.
The team records four times for each finding: event, capture, product availability and review. A decision maker can then distinguish a recent observation awaiting review from an older reviewed observation. That distinction is more valuable than a generic “live” badge on the dashboard.
For consequential response decisions, satellite observations are one source of evidence. Ground reports, operational records and qualified interpretation may be necessary. A missing visible change does not establish safety, especially when the relevant feature is hidden, below the image’s useful detail or outside the measured signal.
Specify freshness around the action
| Planning question | Why it matters |
|---|---|
| How quickly does the condition change? | Determines whether occasional observations are meaningful |
| How old can evidence be when a decision is made? | Sets a usable freshness requirement |
| What minimum feature must be seen? | Connects timing with spatial and sensor needs |
| How much missing coverage is acceptable? | Defines the response to cloud or incomplete acquisition |
| Who reviews an alert, and when? | Turns delivery into an operational decision |
| What happens when evidence is late? | Establishes a fallback before an incident |
Use the answers to negotiate a realistic collection and reporting plan. A frequent observation is not always necessary: slow land-cover change may tolerate a broad window. A fast-moving condition may require a different sensor, local instrument or field workflow. Match the evidence cadence to the phenomenon rather than adopting a frequency because it is advertised.
A small freshness ledger can make these requirements operational. For each site, retain the latest valid capture time, the accepted coverage, the time its result was reviewed and the next action if it becomes too old. Calculate age from capture rather than download. If a new image fails quality review, keep the previous accepted observation with its original timestamp; do not reset its age merely because the pipeline ran again. This separates successful software execution from genuinely updated evidence.
Design the interface so old data cannot look new
Display the acquisition timestamp beside the image or measurement, not only in a hidden metadata panel. If the image is a mosaic or composite, show its observation window. A single timestamp can create a false impression when different parts of the map represent different dates.
Use explicit states such as “awaiting usable observation,” “captured, processing” and “reviewed.” Do not reuse “no change” for a missing observation. Keep the last valid result available for context, but label its age and coverage so users do not mistake continuity of display for continuity of observation.
For recurring reports, summarize observation gaps alongside findings. A monthly chart with three valid observations has a different evidential basis from one with only one. The relevant uncertainty is about what the system could observe, not merely whether its software ran successfully.
Milkypad’s data acquisition focus is about matching Earth data to requirements, including time. When you ask for a price for a monitoring need, include the action you need to take, the maximum useful age of evidence and the consequence of a missing observation. Those details support a meaningful plan far better than asking for a live map without defining what live must accomplish.
Further reading
- Tasking API concepts — Planet.
- Landsat Collection 2 Level-2 science products — USGS.
Sources checked on 14 October 2026.
Sources checked 2026-10-14. Illustrations created by Milkypad. Diagrams and numerical teaching examples are schematic unless explicitly identified otherwise.